The object in this lab was a 500 kg mass attached to a spring which in turn was attached to a ring stand. The object was initially pulled down by human force and its motion was recorded and then tracked and analyzed by the Tracker Software. The motion of the object indicated a pattern of an up and down motion continually, eventually slowing down as time progressed for which the maximum and minimum height decreased for every period. Through tracker, 1 period was analyzed of the objects motion which was 0.8 seconds.
Kinematics:
The Spring Constant is representative of how stiff the spring actually is, defined as the ratio of the force affecting the spring to the displacement caused by it.
Spring Constant (k) can be calculated from the formula:
T = 2(pi)(sqrt(m/k)) ; by solving for k
T/(2(pi)) = (sqrt(m/k))
(T/(2(pi))^2 = m/k
k(T/(2(pi))^2 = m
k = m/(T/(2(pi))^2
k = (m*4(pi)^2)/(T)^2
k = ( (0.500) * (4(pi)^2) ) / (0.64)
k = 30.8 N/m (newtons per meter)

Position vs Time
This graph shows the relationship between position and time for the motion of the object on the spring, and we see that its height (y) decreases from 0 - 0.36 seconds and then increases from 0.40 - 0.78 and that's for only one period. Thus we see the applications of harmonic law as the restoring force is directly proportional to the displacement.

Acceleration vs Time
In this graph the acceleration as noted is the derivative of the velocity vs time graph, so as the object is moving downwards the acceleration increases but when it moves upward the acceleration decreases. Also when a = 0 the forces are balanced, and in this graph we can see two points where this is applicable (around 0.18 and 0.58 seconds).

Velocity vs Time
This graph is the derivative of the position vs time graph and we see that the velocity is zero at around 0.38 seconds which is interesting as the acceleration graph was 0 at two points, but velocity is only at one point.
Forces:

Fg = m * g
Fg = 0.500 kg * 9.8 m/s^2
Fg = 4.9 J
Fs = ma - Fg
Highest Point:
Fs = 0.500 * (1.6) - 4.9
Fs = -4.1 N
Equilibrium Point:
Fs = 0.500 * (0.2) - 4.9
Fs = -4.8 N
Lowest Point:
Fs = 0.500 * (-1.4) - 4.9
Fs = -5.6 N
Fg = 0.500 kg * 9.8 m/s^2
Fg = 4.9 J
Fs = ma - Fg
Highest Point:
Fs = 0.500 * (1.6) - 4.9
Fs = -4.1 N
Equilibrium Point:
Fs = 0.500 * (0.2) - 4.9
Fs = -4.8 N
Lowest Point:
Fs = 0.500 * (-1.4) - 4.9
Fs = -5.6 N
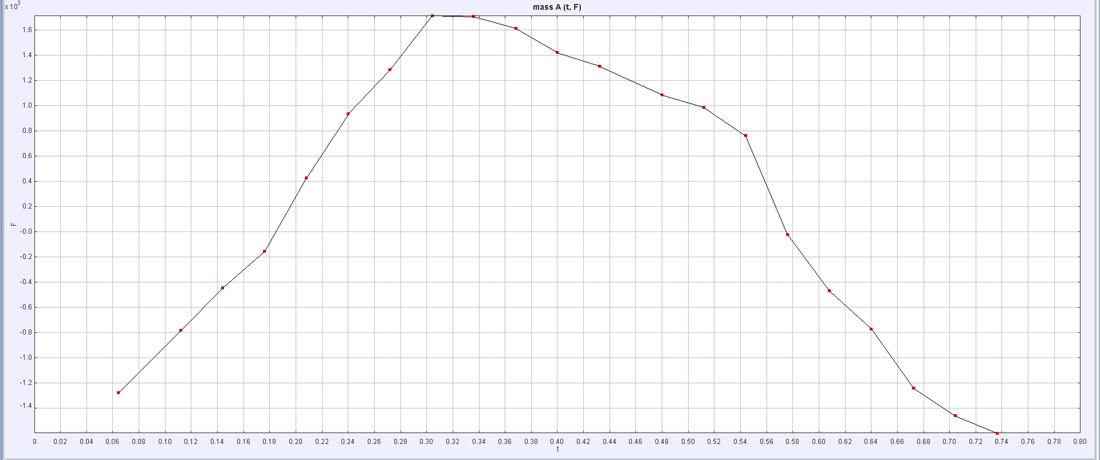
Force vs Time
As the motion of the object begins the forces acting upon the object increase, then after a while they seem to increase. But for each period the effect of the forces begins to decrease thus the object will eventually come to a stop in motion and will return to its starting point in the end.
Energy:

Potential Energy vs Time
In this graph for potential energy it can be noticed that as the object moves downwards the potential energy decreases but as the object is pulled up by the spring the object gains potential energy thus increasing it.

Kinetic Energy vs Time
The kinetic energy graph seems very periodical and it can be noticed that there is more kinetic energy when the object is moving up and down but kinetic energy decreases when it is slowing down at the lowest point or at the highest point because there its motion is limited.

Total Energy vs Time
The total energy graph looks very similar to the kinetic energy graph, probably due to the fact that there is more kinetic energy available than potential energy because potential energy seems to into the negatives when the object slows when its near its highest or lowest height.

Kinetic Energy for Entire Motion:
The kinetic energy graph for the entire motion looks similar to the kinetic energy graph but it now includes a longer time frame so more periods are added in. It can be noticed that the kinetic energy seems to be getting lower and lower for each successive period and in just like the kinetic energy graph for one period, here we can also notice that kinetic energy increases when the object is moving but decreases when the object nears its highest or lowest point. For this graph the frequency seems to be getting faster for each successive period.
The kinetic energy graph for the entire motion looks similar to the kinetic energy graph but it now includes a longer time frame so more periods are added in. It can be noticed that the kinetic energy seems to be getting lower and lower for each successive period and in just like the kinetic energy graph for one period, here we can also notice that kinetic energy increases when the object is moving but decreases when the object nears its highest or lowest point. For this graph the frequency seems to be getting faster for each successive period.
