
1. Was air resistance noticeable?
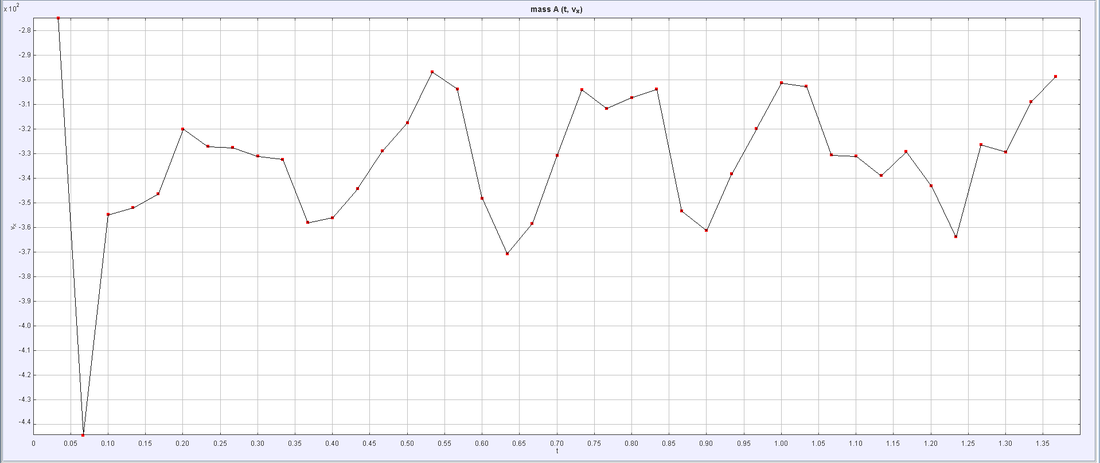
Air resistance was not noticeable in the projectile motion of the kicked soccer ball. As seen by the Velocity X vs Time graph, the velocity of the soccer ball in the x direction is relatively constant thus signifying an unnoticeable change in velocity for the x direction, meaning the air resistance had no noticeable affect on the velocity of the soccer ball which would directly mean that the air resistance was not noticeable because air resistance is the force opposite of the projectiles motion. Also the X Position vs Time graph relays information that the position of the soccer ball in the x direction was very close to linearity with respect to time. Which signifies that air resistance was not noticeable due to the constant linearity of the line which means there wasn't any noticeable effect of any force from the x direction (air resistance), because if there was then the graph line would be much different than being linear. The Y Velocity vs Time graph also closely follows the Y Velocity vs Time graph with no air resistance which has a negative slope and is linear, our graph does have a negative slope but is not perfectly linear, thus again signifying unnoticeable air resistance.
Air resistance was not noticeable in the projectile motion of the kicked soccer ball. As seen by the Velocity X vs Time graph, the velocity of the soccer ball in the x direction is relatively constant thus signifying an unnoticeable change in velocity for the x direction, meaning the air resistance had no noticeable affect on the velocity of the soccer ball which would directly mean that the air resistance was not noticeable because air resistance is the force opposite of the projectiles motion. Also the X Position vs Time graph relays information that the position of the soccer ball in the x direction was very close to linearity with respect to time. Which signifies that air resistance was not noticeable due to the constant linearity of the line which means there wasn't any noticeable effect of any force from the x direction (air resistance), because if there was then the graph line would be much different than being linear. The Y Velocity vs Time graph also closely follows the Y Velocity vs Time graph with no air resistance which has a negative slope and is linear, our graph does have a negative slope but is not perfectly linear, thus again signifying unnoticeable air resistance.
Velocity X vs Time

X vs Time

Velocity Y vs Time
2. Was energy conserved?
Energy was not conserved in my projectile's motion. The most effective way in deciding if energy was or was not conserved would be to look at the Total Energy vs Time graph which is (Kinetic Energy + Gravitational Potential Energy). In order to come to the conclusion that energy was conserved, the initial total energy and the final total energy of the projectiles motion should be equal. Looking at the TE vs Time graph, we can notice that the initial TE is definitely not equal to the final TE, meaning energy was not conserved throughout the projectiles motion. If energy had been conserved, the Total Energy vs Time graph would have been constant with a slope of zero, but here the graph starts off high, then decreases and becomes constant.
Energy was not conserved in my projectile's motion. The most effective way in deciding if energy was or was not conserved would be to look at the Total Energy vs Time graph which is (Kinetic Energy + Gravitational Potential Energy). In order to come to the conclusion that energy was conserved, the initial total energy and the final total energy of the projectiles motion should be equal. Looking at the TE vs Time graph, we can notice that the initial TE is definitely not equal to the final TE, meaning energy was not conserved throughout the projectiles motion. If energy had been conserved, the Total Energy vs Time graph would have been constant with a slope of zero, but here the graph starts off high, then decreases and becomes constant.

Total Energy vs Time
3. Was momentum conserved?
Momentum as a combination of both the x and y direction was not conserved. Looking at Px vs Time graph we can notice that momentum was conserved in the x direction due to the graph being relatively constant. However, in the Py vs Time graph we notice that the graph has a negative slope with close similarity to linearity, thus signifying that momentum was not conserved in the y direction. But if we examine impulse which is (p = m * (delta) v or also p = F * (delta) t ), we can notice that momentum would only change if there was a change in velocity meaning if the initial velocity was a different value than that of the final velocity. Thus if we look at the Vy vs Time graph, we can clearly notice that the initial velocity is a much different value than the final velocity, meaning momentum was not conserved during the projectiles motion.
Momentum as a combination of both the x and y direction was not conserved. Looking at Px vs Time graph we can notice that momentum was conserved in the x direction due to the graph being relatively constant. However, in the Py vs Time graph we notice that the graph has a negative slope with close similarity to linearity, thus signifying that momentum was not conserved in the y direction. But if we examine impulse which is (p = m * (delta) v or also p = F * (delta) t ), we can notice that momentum would only change if there was a change in velocity meaning if the initial velocity was a different value than that of the final velocity. Thus if we look at the Vy vs Time graph, we can clearly notice that the initial velocity is a much different value than the final velocity, meaning momentum was not conserved during the projectiles motion.

Momentum X vs Time

Momentum Y vs Time

Velocity Y vs Time
